
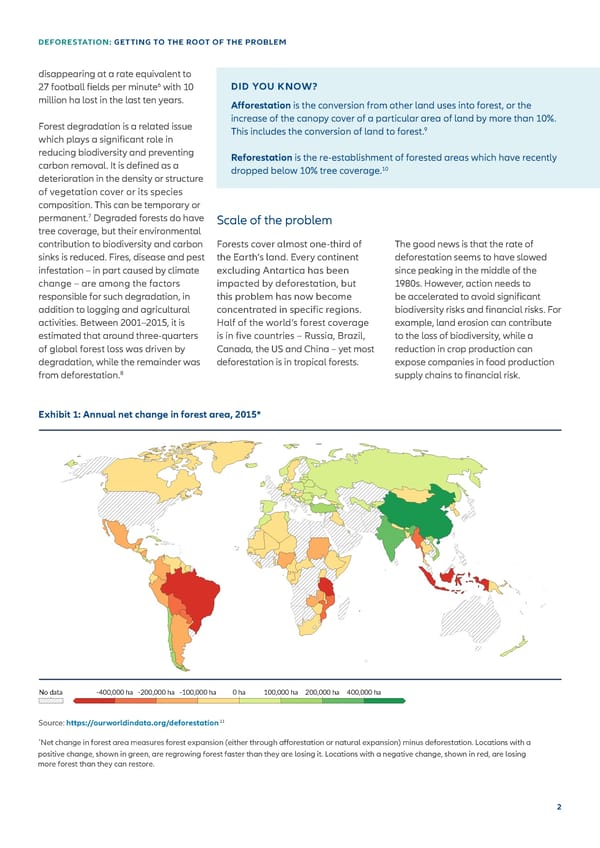
DEFORESTATION: GETTING TO THE ROOT OF THE PROBLEM disappearing at a rate equivalent to 6 DID YOU KNOW? 27 football 昀椀elds per minute with 10 million ha lost in the last ten years. A昀昀orestation is the conversion from other land uses into forest, or the Forest degradation is a related issue increase of the canopy cover of a particular area of land by more than 10%. 9 which plays a signi昀椀cant role in This includes the conversion of land to forest. reducing biodiversity and preventing Reforestation is the re-establishment of forested areas which have recently carbon removal. It is de昀椀ned as a 10 deterioration in the density or structure dropped below 10% tree coverage. of vegetation cover or its species composition. This can be temporary or 7 permanent. Degraded forests do have Scale of the problem tree coverage, but their environmental contribution to biodiversity and carbon Forests cover almost one-third of The good news is that the rate of sinks is reduced. Fires, disease and pest the Earth’s land. Every continent deforestation seems to have slowed infestation – in part caused by climate excluding Antartica has been since peaking in the middle of the change – are among the factors impacted by deforestation, but 1980s. However, action needs to responsible for such degradation, in this problem has now become be accelerated to avoid signi昀椀cant addition to logging and agricultural concentrated in speci昀椀c regions. biodiversity risks and 昀椀nancial risks. For activities. Between 2001–2015, it is Half of the world’s forest coverage example, land erosion can contribute estimated that around three-quarters is in 昀椀ve countries – Russia, Brazil, to the loss of biodiversity, while a of global forest loss was driven by Canada, the US and China – yet most reduction in crop production can degradation, while the remainder was deforestation is in tropical forests. expose companies in food production from deforestation.8 supply chains to 昀椀nancial risk. Annual change in forest area, 2015 Net change in forest area measures forest expansion (either through afforestation or natural expansion) minus Exhibit 1: Annual net change in forest area, 2015* deforestation Annual change in forest area, 2015 Net change in forest area measures forest expansion (either through afforestation or natural expansion) minus deforestation No data -400,000 ha -200,000 ha -100,000 ha 0 ha 100,000 ha 200,000 ha 400,000 ha No data -400,000 ha -200,000 ha -100,000 ha 0 ha 100,000 ha 200,000 ha 400,000 ha 11 Source: UN Food and Agriculture Organization (FAO). Forest Resources Assessment. Source: https://ourworldindata.org/deforestation Note: The UN FAO publish forest data as the annual average on 10- or 5-year timescales. OurWorldInData.org/forests-and-deforestation • CC BY * Source: UN Food and Agriculture Organization (FAO). Forest Resources Assessment. Net change in forest area measures forest expansion (either through afforestation or natural expansion) minus deforestation. Locations with a Note: The UN FAO publish forest data as the annual average on 10- or 5-year timescales. positive change, shown in green, are regrowing forest faster than they are losing it. Locations with a negative change, shown in red, are losing OurWorldInData.org/forests-and-deforestation • CC BY more forest than they can restore. 2
 Deforestation Page 1 Page 3