
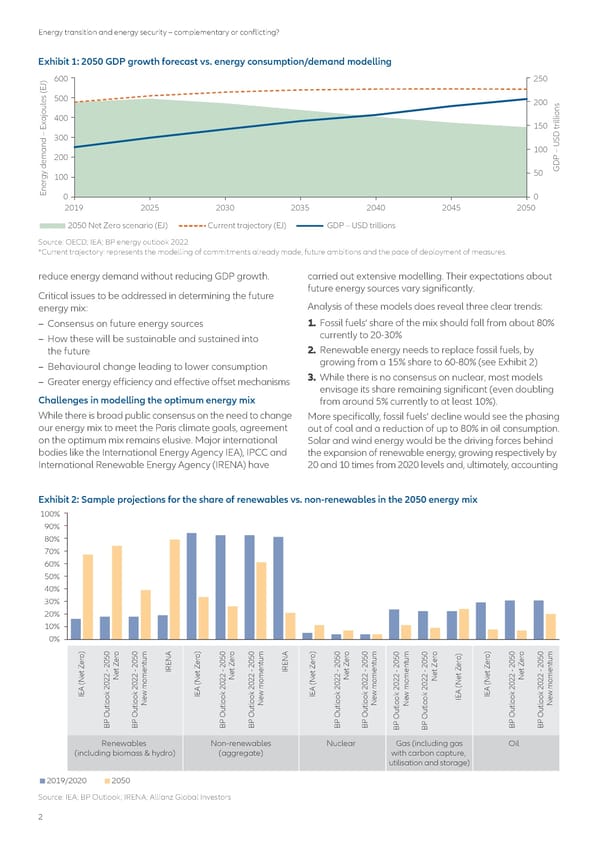
Energy transition and energy security – complementary or conflicting? Exhibit 1: 2050 GDP growth forecast vs. energy consumption/demand modelling 600 250 500 200 400 150 300 100 200 100 50 GDP – USD trillions Energy demand – Exajoules (EJ)0 0 2019 2025 2030 2035 2040 2045 2050 2050 Net Zero scenario (EJ) Current trajectory (EJ) GDP – USD trillions Source: OECD; IEA; BP energy outlook 2022 *Current trajectory: represents the modelling of commitments already made, future ambitions and the pace of deployment of measures. reduce energy demand without reducing GDP growth. carried out extensive modelling. Their expectations about Critical issues to be addressed in determining the future future energy sources vary significantly. energy mix: Analysis of these models does reveal three clear trends: – Consensus on future energy sources 1. Fossil fuels’ share of the mix should fall from about 80% – How these will be sustainable and sustained into currently to 20-30% the future 2. Renewable energy needs to replace fossil fuels, by – Behavioural change leading to lower consumption growing from a 15% share to 60-80% (see Exhibit 2) – Greater energy efficiency and effective offset mechanisms 3. While there is no consensus on nuclear, most models envisage its share remaining significant (even doubling Challenges in modelling the optimum energy mix from around 5% currently to at least 10%). While there is broad public consensus on the need to change More specifically, fossil fuels’ decline would see the phasing our energy mix to meet the Paris climate goals, agreement out of coal and a reduction of up to 80% in oil consumption. on the optimum mix remains elusive. Major international Solar and wind energy would be the driving forces behind bodies like the International Energy Agency IEA), IPCC and the expansion of renewable energy, growing respectively by International Renewable Energy Agency (IRENA) have 20 and 10 times from 2020 levels and, ultimately, accounting Exhibit 2: Sample projections for the share of renewables vs. non-renewables in the 2050 energy mix 100% 90% 80% 70% 60% 50% 40% 30% 20% 10% 0% ) o m ) o m ) o m 0 m 0 o ) ) o m o r o r o r 5 5 r o o r r e u NA r e u NA r e u 0 u 0 e r r e u e 2050Z 2050t E e 2050Z 2050t E e 2050Z 2050t 2 t 2 Z e e 2050Z 2050t Z n R Z n R Z n n Z n - t - e I - t - e I - t - e - e - t Z - t - e t t t t m m m 2 m 2 e t m Ne Ne Ne Ne Ne Ne 2 2 N e Ne Ne ( ( ( 0 0 N ( ( 2022 2022 2022 2022 2022 2022 2 mo 2 2022 2022 A A A A A E k k E k k E k k k k E k k I o o I o o I o o w E I o o o o o o o o o o I o o l l New mo l l New mo l l New moo Ne o l l New mo t t t t t t l l t t u u u u u u t t u u O O O O O O u u O O O O P P P P P P P P B B B B B B P P B B B B Renewables Non-renewables Nuclear Gas (including gas Oil (including biomass & hydro) (aggregate) with carbon capture, utilisation and storage) 2019/2020 2050 Source: IEA; BP Outlook; IRENA; Allianz Global Investors 2
 Energy transition and energy security – complementary or conflicting? Page 1 Page 3