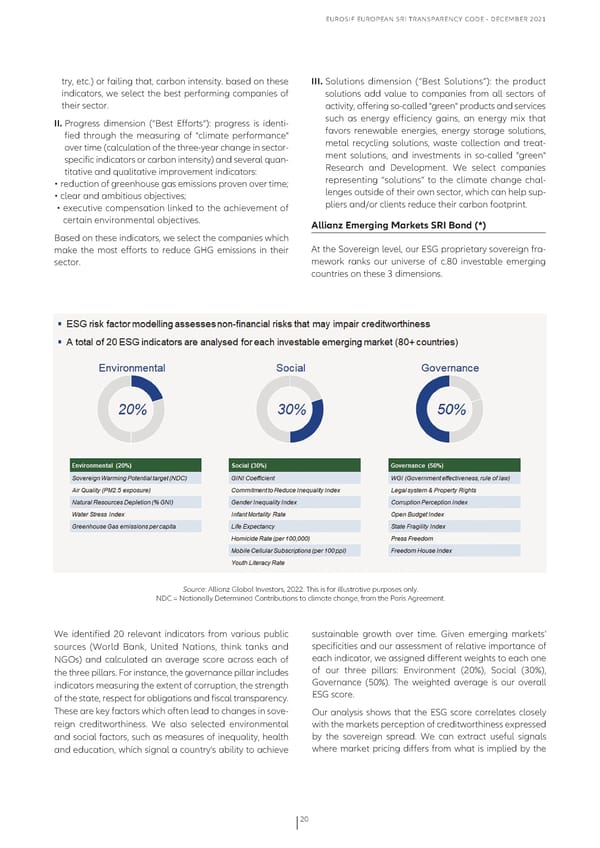
EuRoSIf EuRopEaN SRI TRaNSpaRENcy coDE - DEcEmbER 2021 try, etc.) or failing that, carbon intensity. based on these III. Solutions dimension (“best Solutions”): the product indicators, we select the best performing companies of solutions add value to companies from all sectors of their sector. activity, offering so-called "green" products and services II. progress dimension (“best Efforts“): progress is identi- such as energy efficiency gains, an energy mix that fied through the measuring of "climate performance" favors renewable energies, energy storage solutions, over time (calculation of the three-year change in sector- metal recycling solutions, waste collection and treat- specific indicators or carbon intensity) and several quan- ment solutions, and investments in so-called "green" titative and qualitative improvement indicators: Research and Development. We select companies • reduction of greenhouse gas emissions proven over time; representing “solutions” to the climate change chal- • clear and ambitious objectives; lenges outside of their own sector, which can help sup- • executive compensation linked to the achievement of pliers and/or clients reduce their carbon footprint. certain environmental objectives. Allianz Emerging Markets SRI Bond (*) based on these indicators, we select the companies which make the most efforts to reduce GHG emissions in their at the Sovereign level, our ESG proprietary sovereign fra- sector. mework ranks our universe of c.80 investable emerging countries on these 3 dimensions. Source: allianz Global Investors, 2022. This is for illustrative purposes only. NDc = Nationally Determined contributions to climate change, from the paris agreement. We identified 20 relevant indicators from various public sustainable growth over time. Given emerging markets’ sources (World bank, united Nations, think tanks and specificities and our assessment of relative importance of NGos) and calculated an average score across each of each indicator, we assigned different weights to each one the three pillars. for instance, the governance pillar includes of our three pillars: Environment (20%), Social (30%), indicators measuring the extent of corruption, the strength Governance (50%). The weighted average is our overall of the state, respect for obligations and fiscal transparency. ESG score. These are key factors which often lead to changes in sove- our analysis shows that the ESG score correlates closely reign creditworthiness. We also selected environmental with the markets perception of creditworthiness expressed and social factors, such as measures of inequality, health by the sovereign spread. We can extract useful signals and education, which signal a country’s ability to achieve where market pricing differs from what is implied by the 20
 Eurosif European SRI Transparency Code Page 19 Page 21