
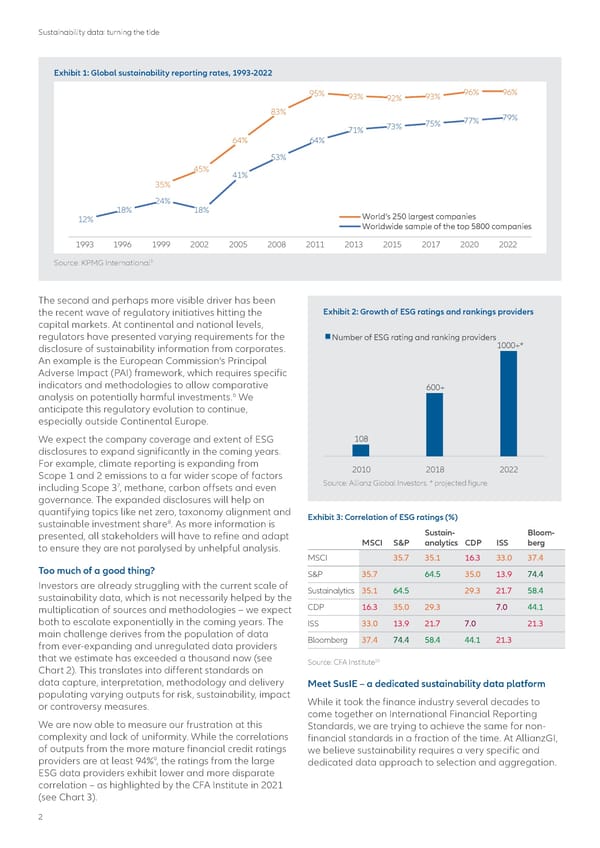
Sustainability data: turning the tide Exhibit 1: Global sustainability reporting rates, 1993-2022 95% 93% 92% 93% 96% 96% 83% 79% 73% 75% 77% 71% 64% 64% 53% 45% 41% 35% 24% 18% 18% World’s 250 largest companies 12% Worldwide sample of the top 5800 companies 1993 1996 1999 2002 2005 2008 2011 2013 2015 2017 2020 2022 Source: KPMG International5 The second and perhaps more visible driver has been the recent wave of regulatory initiatives hitting the Exhibit 2: Growth of ESG ratings and rankings providers capital markets. At continental and national levels, regulators have presented varying requirements for the Number of ESG rating and ranking providers disclosure of sustainability information from corporates. 1000+* An example is the European Commission’s Principal Adverse Impact (PAI) framework, which requires specific indicators and methodologies to allow comparative 600+ analysis on potentially harmful investments.6 We anticipate this regulatory evolution to continue, especially outside Continental Europe. We expect the company coverage and extent of ESG 108 disclosures to expand significantly in the coming years. For example, climate reporting is expanding from 2010 2018 2022 Scope 1 and 2 emissions to a far wider scope of factors Source: Allianz Global Investors. * projected figure. 7 including Scope 3 , methane, carbon offsets and even governance. The expanded disclosures will help on quantifying topics like net zero, taxonomy alignment and Exhibit 3: Correlation of ESG ratings (%) sustainable investment share8. As more information is presented, all stakeholders will have to refine and adapt Sustain- Bloom- to ensure they are not paralysed by unhelpful analysis. MSCI S&P analytics CDP ISS berg MSCI 35.7 35.1 16.3 33.0 37.4 Too much of a good thing? S&P 35.7 64.5 35.0 13.9 74.4 Investors are already struggling with the current scale of Sustainalytics 35.1 64.5 29.3 21.7 58.4 sustainability data, which is not necessarily helped by the multiplication of sources and methodologies – we expect CDP 16.3 35.0 29.3 7.0 44.1 both to escalate exponentially in the coming years. The ISS 33.0 13.9 21.7 7.0 21.3 main challenge derives from the population of data Bloomberg 37.4 74.4 58.4 44.1 21.3 from ever-expanding and unregulated data providers that we estimate has exceeded a thousand now (see 10 Chart 2). This translates into different standards on Source: CFA Institute data capture, interpretation, methodology and delivery Meet SusIE – a dedicated sustainability data platform populating varying outputs for risk, sustainability, impact While it took the finance industry several decades to or controversy measures. come together on International Financial Reporting We are now able to measure our frustration at this Standards, we are trying to achieve the same for non- complexity and lack of uniformity. While the correlations financial standards in a fraction of the time. At AllianzGI, of outputs from the more mature financial credit ratings we believe sustainability requires a very specific and 9 providers are at least 94% , the ratings from the large dedicated data approach to selection and aggregation. ESG data providers exhibit lower and more disparate correlation – as highlighted by the CFA Institute in 2021 (see Chart 3). 2
 Sustainability data Page 1 Page 3