
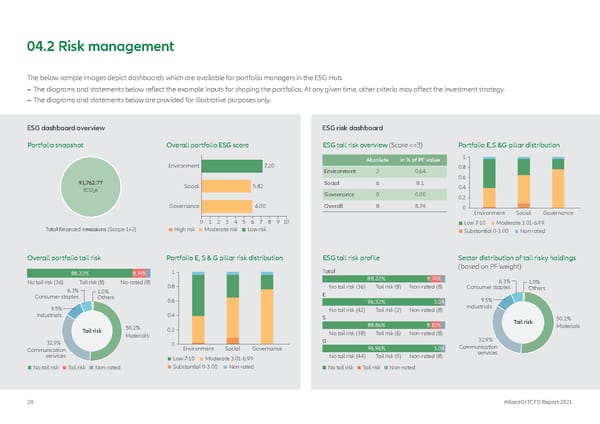
04.2 Risk management The below sample images depict dashboards which are available for portfolio managers in the ESG Hub. – The diagrams and statements below reflect the example inputs for shaping the portfolios. At any given time, other criteria may affect the investment strategy. – The diagrams and statements below are provided for illustrative purposes only. ESG dashboard overview ESG risk dashboard Portfolio snapshot Overall portfolio ESG score ESG tail risk overview (Score <=3) Portfolio E,S &G pillar distribution Absolute in % of PF value 1 Environment 7.20 0.8 Environment 2 0.64 0.6 91,762.77 Social 5.82 Social 6 8.1 0.4 tCO e 2 Governance 0 0.00 0.2 Governance 6.00 Overall 8 8.74 0 Environment Social Governance 0 1 2 3 4 5 6 7 8 9 10 Low 7-10 Moderate 3.01-6.99 Total financed emissions (Scope 1+2) High risk Moderate risk Low risk Substantial 0-3.00 Non rated Overall portfolio tail risk Portfolio E, S & G pillar risk distribution ESG tail risk profile Sector distribution of tail risky holdings 1 Total (based on PF weight) 88.22% 8.74% No tail risk (36) Tail risk (8) No-rated (8) 88.22% 8.74% 6.3% 1.0% 6.3% 1.0% 0.8 No tail risk (36) Tail risk (8) Non-rated (8) Consumer staples Others Consumer staples Others E 0.6 96.32% 3.04 9.5% 9.5% No tail risk (42) Tail risk (2) Non-rated (8) Industrials Industrials 0.4 S 50.2% 88.86% 8.10% Tail risk Materials Tail risk 50.2% 0.2 Materials No tail risk (38) Tail risk (6) Non-rated (8) 32.9% 0 G 32.9% Communication Environment Social Governance 96.96% 3.04 Communication serivices No tail risk (44) Tail risk (0) Non-rated (8) serivices Low 7-10 Moderate 3.01-6.99 No tail risk Tail risk Non-rated Substantial 0-3.00 Non rated No tail risk Tail risk Non-rated 20 AllianzGI TCFD Report 2021
 TCFD Report Page 19 Page 21