
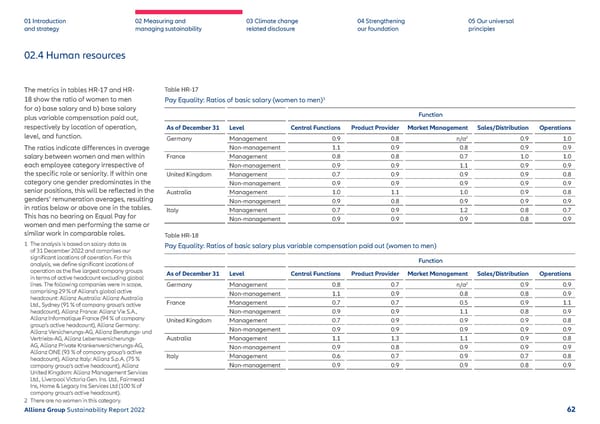
01 Introduction and strategy 02 Measuring and managing sustainability 03 Climate change related disclosure 04 Strengthening our foundation 05 Our universal principles 02.4 Human resources The metrics in tables HR-17 and HR- 18 show the ratio of women to men for a) base salary and b) base salary plus variable compensation paid out, respectively by location of operation, level, and function. The ratios indicate differences in average salary between women and men within each employee category irrespective of the specific role or seniority. If within one category one gender predominates in the senior positions, this will be reflected in the genders’ remuneration averages, resulting in ratios below or above one in the tables. This has no bearing on Equal Pay for women and men performing the same or similar work in comparable roles. Table HR-17 Pay Equality: Ratios of basic salary (women to men) 1 Function As of December 31 Level Central Functions Product Provider Market Management Sales/Distribution Operations Germany Management 0.9 0.8 n/a 2 0.9 1.0 Non-management 1.1 0.9 0.8 0.9 0.9 France Management 0.8 0.8 0.7 1.0 1.0 Non-management 0.9 0.9 1.1 0.9 0.9 United Kingdom Management 0.7 0.9 0.9 0.9 0.8 Non-management 0.9 0.9 0.9 0.9 0.9 Australia Management 1.0 1.1 1.0 0.9 0.8 Non-management 0.9 0.8 0.9 0.9 0.9 Italy Management 0.7 0.9 1.2 0.8 0.7 Non-management 0.9 0.9 0.9 0.8 0.9 Table HR-18 Pay Equality: Ratios of basic salary plus variable compensation paid out (women to men) Function As of December 31 Level Central Functions Product Provider Market Management Sales/Distribution Operations Germany Management 0.8 0.7 n/a 2 0.9 0.9 Non-management 1.1 0.9 0.8 0.8 0.9 France Management 0.7 0.7 0.5 0.9 1.1 Non-management 0.9 0.9 1.1 0.8 0.9 United Kingdom Management 0.7 0.9 0.9 0.9 0.8 Non-management 0.9 0.9 0.9 0.9 0.9 Australia Management 1.1 1.3 1.1 0.9 0.8 Non-management 0.9 0.8 0.9 0.9 0.9 Italy Management 0.6 0.7 0.9 0.7 0.8 Non-management 0.9 0.9 0.9 0.8 0.9 1 The analysis is based on salary data as of 31 December 2022 and comprises our significant locations of operation. For this analysis, we define significant locations of operation as the five largest company groups in terms of active headcount excluding global lines. The following companies were in scope, comprising 29 % of Allianz’s global active headcount: Allianz Australia: Allianz Australia Ltd., Sydney (91 % of company group’s active headcount), Allianz France: Allianz Vie S.A., Allianz Informatique France (94 % of company group’s active headcount), Allianz Germany: Allianz Versicherungs-AG, Allianz Beratungs- und Vertriebs-AG, Allianz Lebensversicherungs- AG, Allianz Private Krankenversicherungs-AG, Allianz ONE (93 % of company group’s active headcount), Allianz Italy: Allianz S.p.A. (75 % company group’s active headcount), Allianz United Kingdom: Allianz Management Services Ltd., Liverpool Victoria Gen. Ins. Ltd., Fairmead Ins, Home & Legacy Ins Services Ltd (100 % of company group’s active headcount). 2 There are no women in this category. Allianz Group Sustainability Report 2022 62
 Sustainability Report 2022 | Allianz Page 62 Page 64