
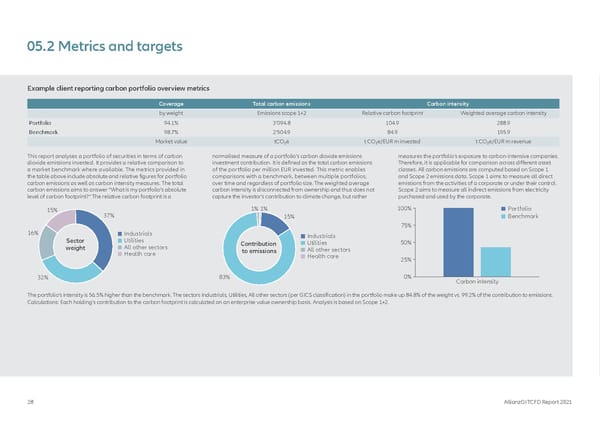
05.2 Metrics and targets Example client reporting carbon portfolio overview metrics Coverage Total carbon emissions Carbon intensity by weight Emissions scope 1+2 Relative carbon footprint Weighted average carbon intensity Portfolio 94.1% 3'094.8 104.9 288.9 Benchmark 98.7% 2'504.9 84.9 195.9 Market value tCO₂e t CO₂e/EUR m invested t CO₂e/EUR m revenue This report analyses a portfolio of securities in terms of carbon normalised measure of a portfolio’s carbon dioxide emissions measures the portfolio’s exposure to carbon-intensive companies. dioxide emissions invested. It provides a relative comparison to investment contribution. It is defined as the total carbon emissions Therefore, it is applicable for comparison across different asset a market benchmark where available. The metrics provided in of the portfolio per million EUR invested. This metric enables classes. All carbon emissions are computed based on Scope 1 the table above include absolute and relative figures for portfolio comparisons with a benchmark, between multiple portfolios, and Scope 2 emissions data. Scope 1 aims to measure all direct carbon emissions as well as carbon intensity measures. The total over time and regardless of portfolio size. The weighted average emissions from the activities of a corporate or under their control. carbon emissions aims to answer “What is my portfolio’s absolute carbon intensity is disconnected from ownership and thus does not Scope 2 aims to measure all indirect emissions from electricity level of carbon footprint?” The relative carbon footprint is a capture the investor’s contribution to climate change, but rather purchased and used by the corporate. 15% 1%1% 100% Portfolio 37% 15% Benchmark 75% 16% Industrials Industrials Sector Utilities Contribution Utilities 50% weight All other sectors to emissions All other sectors Health care Health care 25% 32% 83% 0% Carbon intensity The portfolio’s intensity is 56.5% higher than the benchmark. The sectors Industrials, Utilities, All other sectors (per GICS classification) in the portfolio make up 84.8% of the weight vs. 99.2% of the contribution to emissions. Calculations: Each holding’s contribution to the carbon footprint is calculated on an enterprise value ownership basis. Analysis is based on Scope 1+2. 28 AllianzGI TCFD Report 2021
 TCFD Report Page 27 Page 29