
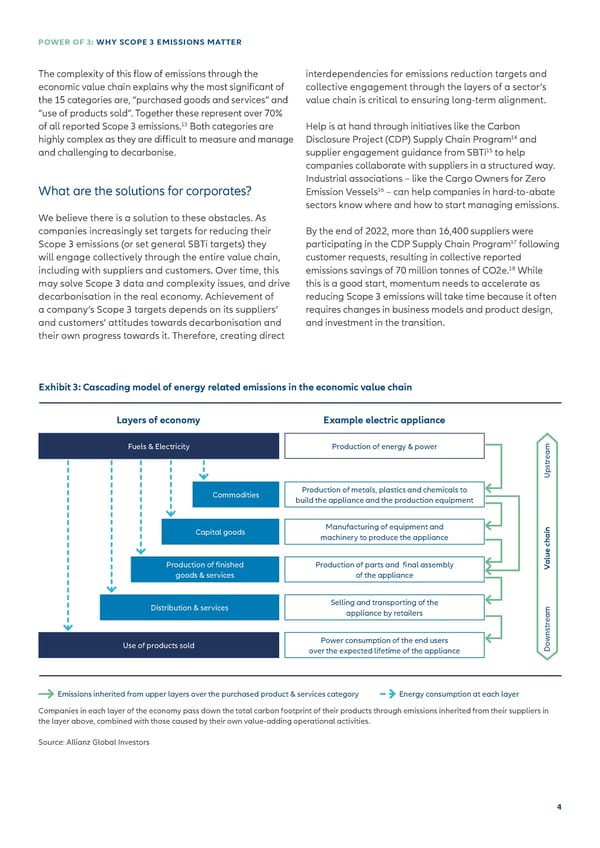
POWER OF 3: WHY SCOPE 3 EMISSIONS MATTER The complexity of this 昀氀ow of emissions through the interdependencies for emissions reduction targets and economic value chain explains why the most signi昀椀cant of collective engagement through the layers of a sector’s the 15 categories are, “purchased goods and services” and value chain is critical to ensuring long-term alignment. “use of products sold”. Together these represent over 70% 13 of all reported Scope 3 emissions. Both categories are Help is at hand through initiatives like the Carbon 14 highly complex as they are di昀케cult to measure and manage Disclosure Project (CDP) Supply Chain Program and 15 and challenging to decarbonise. supplier engagement guidance from SBTi to help companies collaborate with suppliers in a structured way. Industrial associations – like the Cargo Owners for Zero 16 What are the solutions for corporates? Emission Vessels – can help companies in hard-to-abate sectors know where and how to start managing emissions. We believe there is a solution to these obstacles. As companies increasingly set targets for reducing their By the end of 2022, more than 16,400 suppliers were 17 Scope 3 emissions (or set general SBTi targets) they participating in the CDP Supply Chain Program following will engage collectively through the entire value chain, customer requests, resulting in collective reported 18 including with suppliers and customers. Over time, this emissions savings of 70 million tonnes of CO2e. While may solve Scope 3 data and complexity issues, and drive this is a good start, momentum needs to accelerate as decarbonisation in the real economy. Achievement of reducing Scope 3 emissions will take time because it often a company’s Scope 3 targets depends on its suppliers’ requires changes in business models and product design, and customers’ attitudes towards decarbonisation and and investment in the transition. their own progress towards it. Therefore, creating direct Exhibit 3: Cascading model of energy related emissions in the economic value chain Layers of economy Example electric appliance Fuels & Electricity Production of energy & power am e tr s p U Commodities Production of metals, plastics and chemicals to build the appliance and the production equipment Manufacturing of equipment and n Capital goods i machinery to produce the appliance a h c e u Production of 昀椀nished Production of parts and 昀椀nal assembly al goods & services of the appliance V Distribution & services Selling and transporting of the appliance by retailers am e tr s Power consumption of the end users n Use of products sold ow over the expected lifetime of the appliance D Emissions inherited from upper layers over the purchased product & services category Energy consumption at each layer Companies in each layer of the economy pass down the total carbon footprint of their products through emissions inherited from their suppliers in the layer above, combined with those caused by their own value-adding operational activities. Source: Allianz Global Investors 4
 Scope 3 Emissions Page 3 Page 5