
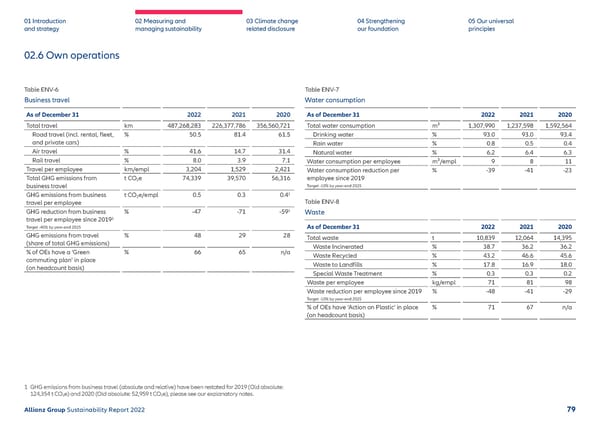
01 Introduction and strategy 02 Measuring and managing sustainability 03 Climate change related disclosure 04 Strengthening our foundation 05 Our universal principles 02.6 Own operations Table ENV-6 Business travel As of December 31 2022 2021 2020 Total travel km 487,268,283 226,377,786 356,560,721 Road travel (incl. rental, fleet, and private cars) % 50.5 81.4 61.5 Air travel % 41.6 14.7 31.4 Rail travel % 8.0 3.9 7.1 Tr avel per employee km/empl 3,204 1,529 2,421 Total GHG emissions from business travel t CO 2 e 74,339 39,570 56,316 GHG emissions from business travel per employee t CO 2 e/empl 0.5 0.3 0.4 1 GHG reduction from business travel per employee since 2019 1 Target -40% by year-end 2025 % -47 -71 -59 1 GHG emissions from travel (share of total GHG emissions) % 48 29 28 % of OEs have a ‘Green commuting plan’ in place (on headcount basis) % 66 65 n/a Table ENV-7 Water consumption As of December 31 2022 2021 2020 Total water consumption m³ 1,307,990 1,237,598 1,592,564 Drinking water % 93.0 93.0 93.4 Rain water % 0.8 0.5 0.4 Natural water % 6.2 6.4 6.3 Water consumption per employee m³/empl 9 8 11 Water consumption reduction per employee since 2019 Target -10% by year-end 2025 % -39 -41 -23 Table ENV-8 Waste As of December 31 2022 2021 2020 Total waste t 10,839 12,064 14,395 Waste Incinerated % 38.7 36.2 36.2 Waste Recycled % 43.2 46.6 45.6 Waste to Landfills % 17.8 16.9 18.0 Special Waste Treatment % 0.3 0.3 0.2 Waste per employee kg/empl 71 81 98 Waste reduction per employee since 2019 Target -10% by year-end 2025 % -48 -41 -29 % of OEs have ‘Action on Plastic’ in place (on headcount basis) % 71 67 n/a 1 GHG emissions from business travel (absolute and relative) have been restated for 2019 (Old absolute: 124,354 t CO 2 e) and 2020 (Old absolute: 52,959 t CO 2 et CO 2 e), please see our explanatory notes. Allianz Group Sustainability Report 2022 79
 Sustainability Report 2022 | Allianz Page 79 Page 81