
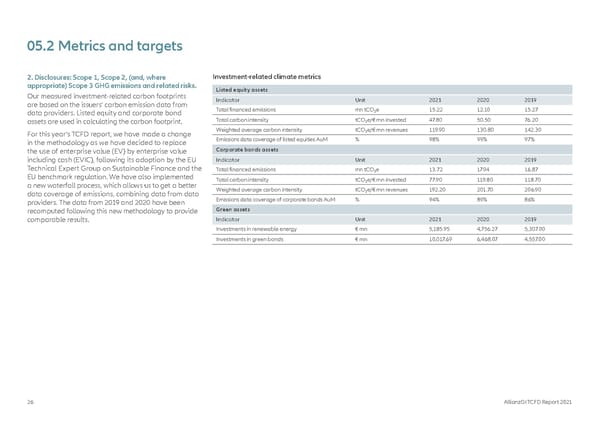
05.2 Metrics and targets 2. Disclosures: Scope 1, Scope 2, (and, where Investment-related climate metrics appropriate) Scope 3 GHG emissions and related risks. Listed equity assets Our measured investment-related carbon footprints Indicator Unit 2021 2020 2019 are based on the issuers’ carbon emission data from Total financed emissions mn tCO₂e 15.22 12.10 15.27 data providers. Listed equity and corporate bond assets are used in calculating the carbon footprint. Total carbon intensity tCO₂e/€ mn invested 47.80 50.50 76.20 For this year’s TCFD report, we have made a change Weighted average carbon intensity tCO₂e/€ mn revenues 119.90 130.80 142.30 in the methodology as we have decided to replace Emissions data coverage of listed equities AuM % 98% 99% 97% the use of enterprise value (EV) by enterprise value Corporate bonds assets including cash (EVIC), following its adoption by the EU Indicator Unit 2021 2020 2019 Technical Expert Group on Sustainable Finance and the Total financed emissions mn tCO₂e 13.72 17.94 16.87 EU benchmark regulation. We have also implemented Total carbon intensity tCO₂e/€ mn invested 77.90 119.80 118.70 a new waterfall process, which allows us to get a better Weighted average carbon intensity tCO₂e/€ mn revenues 192.20 201.70 206.90 data coverage of emissions, combining data from data Emissions data coverage of corporate bonds AuM % 94% 89% 86% providers. The data from 2019 and 2020 have been recomputed following this new methodology to provide Green assets comparable results. Indicator Unit 2021 2020 2019 Investments in renewable energy € mn 5,185.95 4,756.27 5,307.00 Investments in green bonds € mn 10,017.69 6,468.07 4,557.00 26 AllianzGI TCFD Report 2021
 TCFD Report Page 25 Page 27