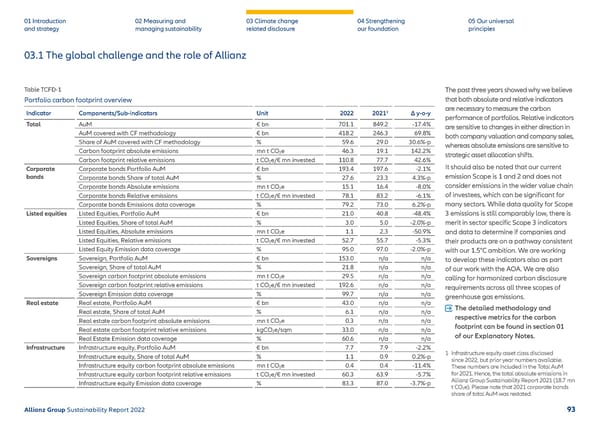
01 Introduction and strategy 02 Measuring and managing sustainability 03 Climate change related disclosure 04 Strengthening our foundation 05 Our universal principles 03.1 The global challenge and the role of Allianz Table TCFD-1 Portfolio carbon footprint overview Indicator Components/Sub-indicators Unit 2022 2021 1 Δ y-o-y Total AuM € bn 701.1 849.2 -17.4% AuM covered with CF methodology € bn 418.2 246.3 69.8% Share of AuM covered with CF methodology % 59.6 29.0 30.6%-p Carbon footprint absolute emissions mn t CO 2 e 46.3 19.1 142.2% Carbon footprint relative emissions t CO 2 e/€ mn invested 110.8 77.7 42.6% Corporate bonds Corporate bonds Portfolio AuM € bn 193.4 197.6 -2.1% Corporate bonds Share of total AuM % 27.6 23.3 4.3%-p Corporate bonds Absolute emissions mn t CO 2 e 15.1 16.4 -8.0% Corporate bonds Relative emissions t CO 2 e/€ mn invested 78.1 83.2 -6.1% Corporate bonds Emissions data coverage % 79.2 73.0 6.2%-p Listed equities Listed Equities, Portfolio AuM € bn 21.0 40.8 -48.4% Listed Equities, Share of total AuM % 3.0 5.0 -2.0%-p Listed Equities, Absolute emissions mn t CO 2 e 1.1 2.3 -50.9% Listed Equities, Relative emissions t CO 2 e/€ mn invested 52.7 55.7 -5.3% Listed Equity Emission data coverage % 95.0 97.0 -2.0%-p Sovereigns Sovereign, Portfolio AuM € bn 153.0 n/a n/a Sovereign, Share of total AuM % 21.8 n/a n/a Sovereign carbon footprint absolute emissions mn t CO 2 e 29.5 n/a n/a Sovereign carbon footprint relative emissions t CO 2 e/€ mn invested 192.6 n/a n/a Sovereign Emission data c over age % 99.7 n/a n/a Real estate Real estate, Portfolio AuM € bn 43.0 n/a n/a Real estate, Share of total AuM % 6.1 n/a n/a Real estate carbon footprint absolute emissions mn t CO 2 e 0.3 n/a n/a Real estate carbon footprint relative emissions kgCO 2 e/sqm 33.0 n/a n/a Real Estate Emission data coverage % 60.6 n/a n/a Infrastructure Infrastructure equity, Portfolio AuM € bn 7.7 7.9 -2.2% Infrastructure equity, Share of total AuM % 1.1 0.9 0.2%-p Infrastructure equity carbon footprint absolute emissions mn t CO 2 e 0.4 0.4 -11.4% Infrastructure equity carbon footprint relative emissions t CO 2 e/€ mn invested 60.3 63.9 -5.7% Infrastructure equity Emission data coverage % 83.3 87.0 -3.7%-p The past three years showed why we believe that both absolute and relative indicators are necessary to measure the carbon performance of portfolios. Relative indicators are sensitive to changes in either direction in both company valuation and company sales, whereas absolute emissions are sensitive to strategic asset allocation shifts. It should also be noted that our current emission Scope is 1 and 2 and does not consider emissions in the wider value chain of investees, which can be significant for many sectors. While data quality for Scope 3 emissions is still comparably low, there is merit in sector specific Scope 3 indicators and data to determine if companies and their products are on a pathway consistent with our 1.5°C ambition. We are working to develop these indicators also as part of our work with the AOA. We are also calling for harmonized carbon disclosure requirements across all three scopes of greenhouse gas emissions. The detailed methodology and respective metrics for the carbon footprint can be found in section 01 of our Explanatory Notes. 1 Infrastructure equity asset class disclosed since 2022, but prior year numbers available. These numbers are included in the Total AuM for 2021. Hence, the total absolute emissions in Allianz Group Sustainability Report 2021 (18.7 mn t CO 2 e ). Please note that 2021 corporate bonds share of total AuM was restated. Allianz Group Sustainability Report 2022 93
 Sustainability Report 2022 | Allianz Page 93 Page 95