
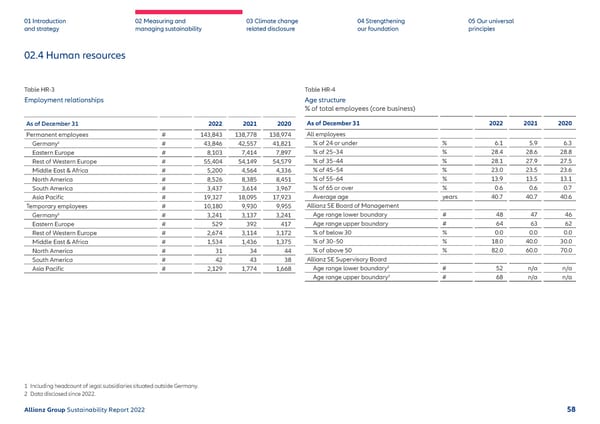
01 Introduction and strategy 02 Measuring and managing sustainability 03 Climate change related disclosure 04 Strengthening our foundation 05 Our universal principles 02.4 Human resources Table HR-3 Employment relationships As of December 31 2022 2021 2020 Permanent employees # 143,843 138,778 138,974 Germany 1 # 43,846 42,557 41,821 Eastern Europe # 8,103 7,414 7,897 Rest of Western Europe # 55,404 54,149 54,579 Middle East & Africa # 5,200 4,564 4,336 North America # 8,526 8,385 8,451 South America # 3,437 3,614 3,967 Asia Pacific # 19,327 18,095 17,923 Temporary employees # 10,180 9,930 9,955 Germany 1 # 3,241 3,137 3,241 Eastern Europe # 529 392 417 Rest of Western Europe # 2,674 3,114 3,172 Middle East & Africa # 1,534 1,436 1,375 North America # 31 34 44 South America # 42 43 38 Asia Pacific # 2,129 1,774 1,668 Table HR-4 Age structure % of total employees (core business) As of December 31 2022 2021 2020 All employees % of 24 or under % 6.1 5.9 6.3 % of 25–34 % 28.4 28.6 28.8 % of 35–44 % 28.1 27.9 27.5 % of 45–54 % 23.0 23.5 23.6 % of 55–64 % 13.9 13.5 13.1 % of 65 or over % 0.6 0.6 0.7 Average age years 40.7 40.7 40.6 Allianz SE Board of Management Age range lower boundary # 48 47 46 Age range upper boundary # 64 63 62 % of below 30 % 0.0 0.0 0.0 % of 30–50 % 18.0 40.0 30.0 % of above 50 % 82.0 60.0 70.0 Allianz SE Supervisory Bo ard Age range lower boundary 2 # 52 n/a n/a Age range upper boundary 2 # 68 n/a n/a 1 Including headcount of legal subsidiaries situated outside Germany. 2 Data disclosed since 2022. Allianz Group Sustainability Report 2022 58
 Sustainability Report 2022 | Allianz Page 58 Page 60